![]()
Before diving in head first, let's define some terms. After all, if we don't know what we are calculating or how to calculate it, then this is going to be a short tutorial. I will try to approach this as simply as possible and not get too carried away, mainly because I forgot all of the math I was taught in school. Oops. Let's begin by stating what we know, what we can estimate, and what we want to know.
What do we know? We know how much cash a company generated during the past 12 months. Let's call this Cash Flow. Cash flow is nice, but what is even better is cash flow that is left over after the company has paid for the cost of doing business. That is money it can use to reinvest in the company, pay back to stockholders in the form of dividends, purchase other investments or even companies, or just stick it under the company mattress. We shall call this Free Cash Flow, or FCF. I will use FCF for purposes of this tutorial. You can get this number from numerous sources, including Yahoo (type in a ticker at Yahoo Finance and look at the Key Statistics page), or calculate it yourself. Different people calculate FCF based on different inputs, so as you become more experienced you may try out various FCF scenarios. Here is an artical on the Joy of Free Cash Flow that contains more information.
What else do we know?We also know how many shares of stock the company has outstanding. Let's call this Total Shares. This can also be found at a site such as Yahoo Finance.
What can we estimate? We can estimate (read: guess) how much a company will grow in the coming years. Let's call this the Free Cash Flow Growth Rate. Growth numbers can come from anywhere, but often people will use analyst estimates. Again see any of a number of financial web sites, including Yahoo Finance.
What do we want? Given our estimate of company growth, what is a fair price to pay for the company today? Let's call this Intrinsic Value.
Why do we care? Well, if the company's stock is currently priced less than what we think it should be, it might go up. Or it might not. Remember, this is not precise, it is more art than science.
We now know what we know and we know what we want, so let's get started on the spreadsheet. If you installed OpenOffice.org, good for you, just follow along. This tutorial was put together using OpenOffice.org version 1.1.0, so if you are using a different version hopefully the instructions will still match. If you are using Excel, then follow along as best you can, the instructions should still apply. Start up the spreadsheet program, you should see something like Figure 1. If you do not have a blank document, create a new document (File->New->Spreadsheet).
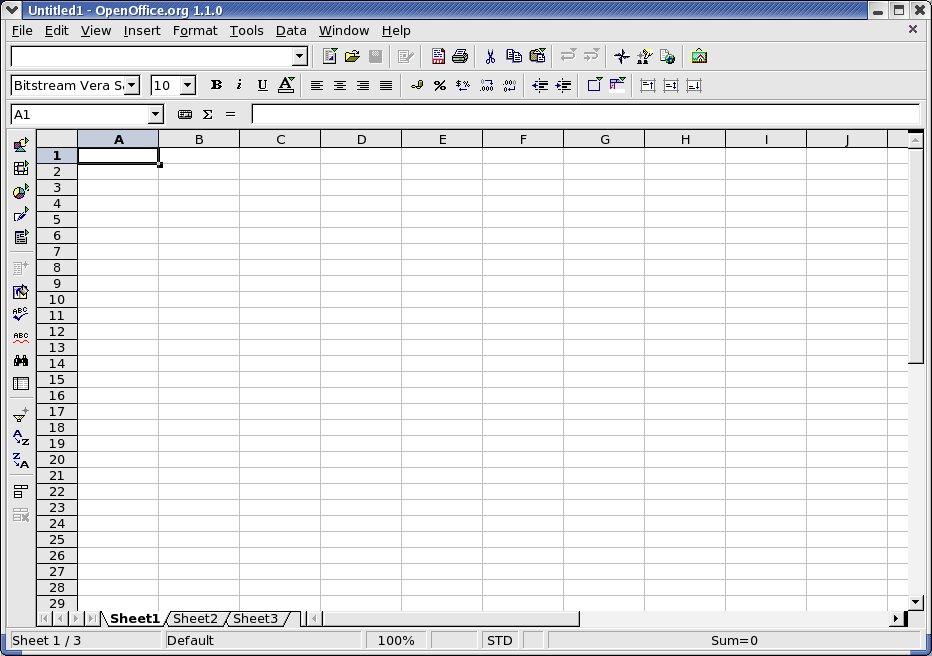
Figure 1: Blank spreadsheet (click for larger image)
The spreadsheet is made up of cells, and each cell is referenced by its column header/row header intersection point. Columns are letters and rows are numbers, so the cell in the upper left hand corner is A1. The cell to the right of that is B1. The cell below A1 is A2. You get the idea. Each cell can contain content, and each cell can be formatted in various ways. We will see that soon enough.
Click on cell A8 and type the following: FCF (ttm):
Press Enter and admire the results. Should you need to edit the cell again, you can click the cell and use the Cell Input Line as seen in Figure 2.
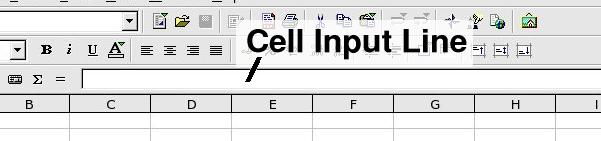
Figure 2: Cell Input Line
Remember FCF from earlier. The (ttm) stands for Trailing Twelve Months, which just means the previous four quarters of reported numbers (financials) for the company. The company only puts out the annual statement once a year, so that may not represent the most recent year's worth of financials, which is why we use (ttm).
Now for some more editing.
Click on cell A9 and type the following: Total Shares:
So far we have just been entering labels. Let's now enter some actual numbers. For purposes of discussion, let's say we are evaulating a fictional company called What In The World, Inc. (fictional ticker symbol WITW). After looking up their financial information, we find that WITW has a FCF (ttm) value of $13 million, and has 8 million shares outstanding.
Click on cell B8 and enter: 13000000
Click on cell B9 and enter: 8000000
It would be nice if the FCF cell (B8) touted the fact that it was in dollars, so let's format the cell. Click on cell B8, and then go to the Format menu and select the Cells... entry. The Format Cells dialog should appear, click on the Numbers tab and select Currency. Use the defaults and click OK. If cell B8 suddenly displays ###, fear not. That just means that there is information in the cell, but it is not wide enough to display it. Put your mouse between the header for column B and column C, and click and drag column B to the right to make it wider. After that, things should look like Figure 3.
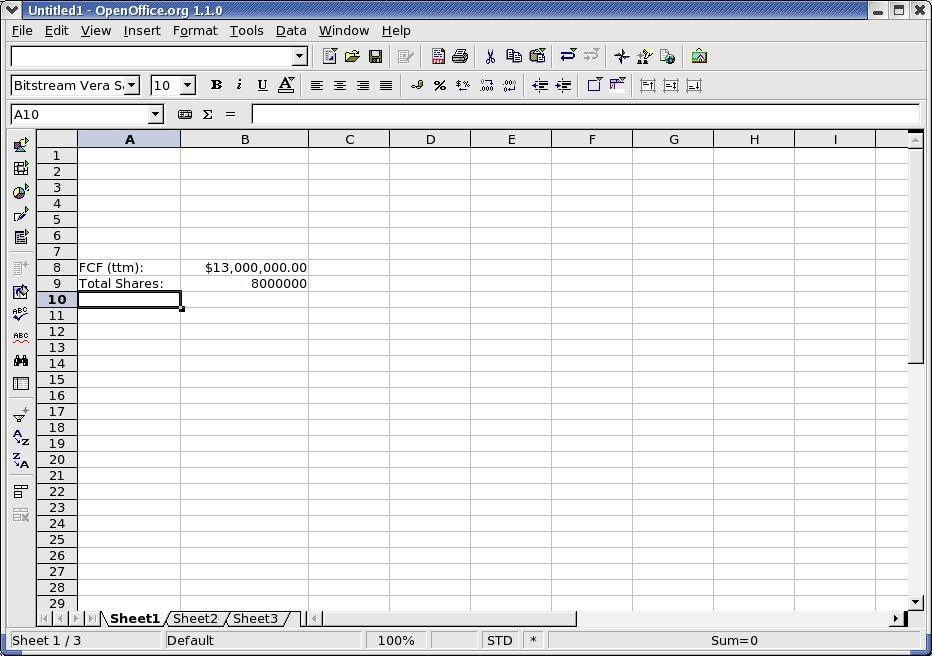
Figure 3: First entries (click for full image)
So far so good, let's head to Part 2.